Compiled by Pricebookr. Published and sources checked September 25, 2026. 107 dated figures from 4 original publishers. Download CSV · Evidence ledger.
Plumbing wages and pay distribution
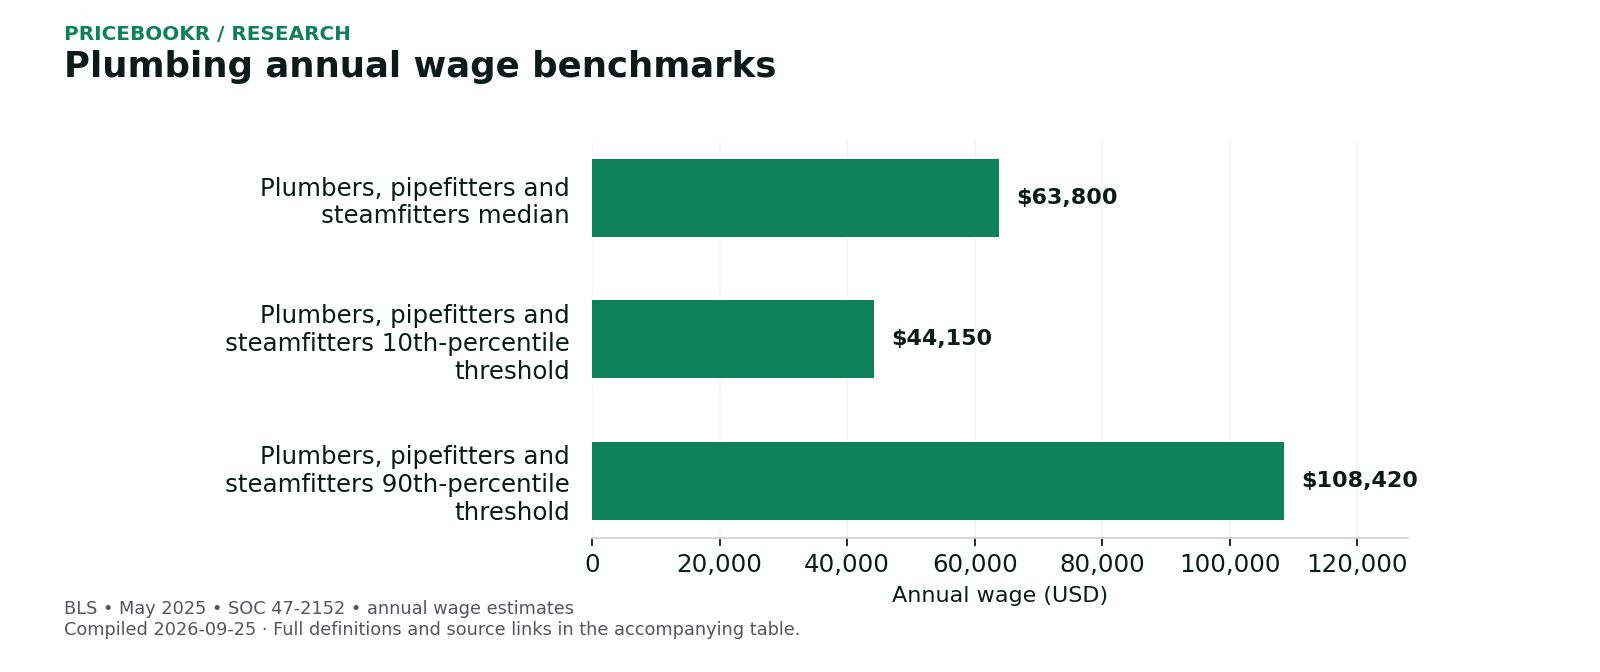
BLS reports a $63,800 median annual wage for plumbers, pipefitters and steamfitters in May 2025. The industry medians below describe workers in this occupation, not business revenue or customer billing rates.
United States; May 2025 OEWS; SOC 47-2152. Wage estimates exclude self-employed workers. Percentile thresholds are not starting or maximum salaries.
| Measure / group | Figure | Period / original source |
|---|---|---|
| Plumbers, pipefitters and steamfitters median # | $63,800 | May 2025 U.S. Bureau of Labor Statistics |
| Plumbers, pipefitters and steamfitters 10th-percentile threshold # | $44,150 | May 2025 U.S. Bureau of Labor Statistics |
| Plumbers, pipefitters and steamfitters 90th-percentile threshold # | $108,420 | May 2025 U.S. Bureau of Labor Statistics |
| Occupation median: Government (excluding education/hospitals) # | $71,660 | May 2025 U.S. Bureau of Labor Statistics |
| Occupation median: Manufacturing # | $65,770 | May 2025 U.S. Bureau of Labor Statistics |
| Occupation median: Heavy and civil engineering construction # | $63,270 | May 2025 U.S. Bureau of Labor Statistics |
| Occupation median: Plumbing, heating and AC contractors # | $63,010 | May 2025 U.S. Bureau of Labor Statistics |
| Construction trades workers median (comparison) # | $58,150 | May 2025 U.S. Bureau of Labor Statistics |
| All occupations median (comparison) # | $50,980 | May 2025 U.S. Bureau of Labor Statistics |
Plumbing employment and hiring outlook
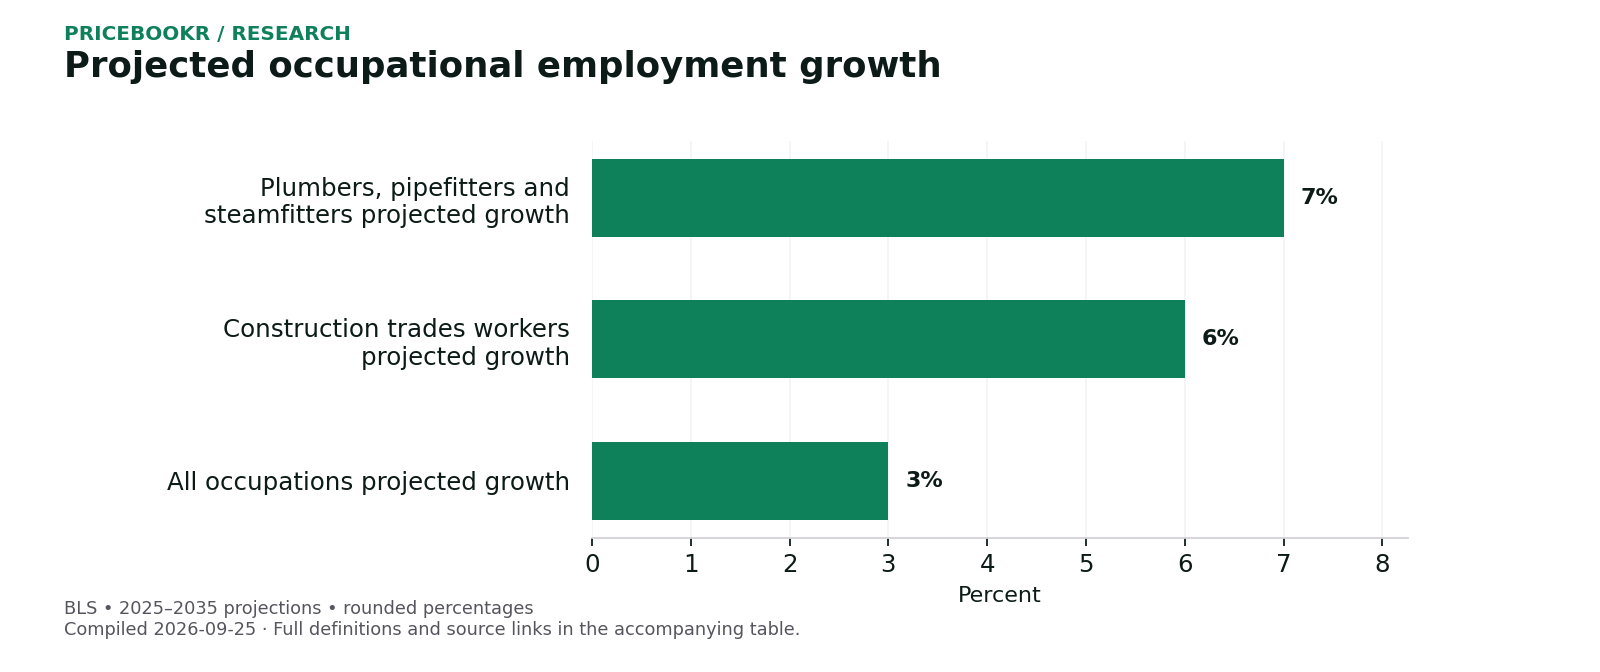
BLS projects 7% growth for plumbers, pipefitters and steamfitters from 2025 to 2035. Annual openings include workers changing occupations or leaving the labor force; they are not a count of currently unfilled positions.
United States; BLS Employment Projections. Forecasts are rounded and are not guarantees.
| Measure / group | Figure | Period / original source |
|---|---|---|
| Plumbers, pipefitters and steamfitters employment # | 510,600 jobs | 2025 U.S. Bureau of Labor Statistics |
| Plumbers, pipefitters and steamfitters projected employment # | 545,200 jobs | 2035 projection U.S. Bureau of Labor Statistics |
| Plumbers, pipefitters and steamfitters average annual openings # | 42,000 openings per year | 2025–2035 projection U.S. Bureau of Labor Statistics |
| Plumbers, pipefitters and steamfitters projected growth # | 7% | 2025–2035 projection U.S. Bureau of Labor Statistics |
| Construction trades workers projected growth # | 6% | 2025–2035 projection U.S. Bureau of Labor Statistics |
| All occupations projected growth # | 3% | 2025–2035 projection U.S. Bureau of Labor Statistics |
Where plumbers, pipefitters and steamfitters work
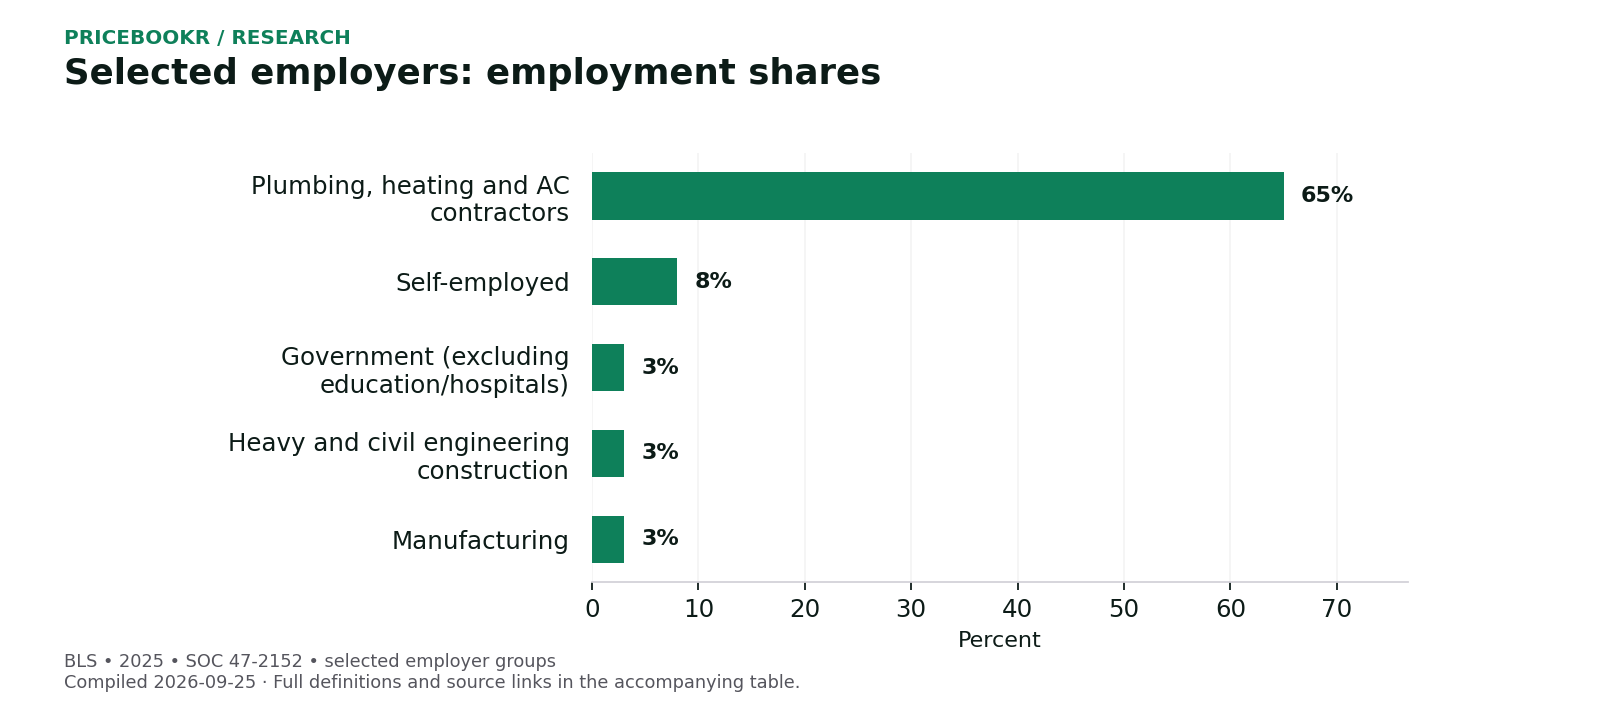
The occupation spans several industries. These selected employer shares include self-employment, unlike the wage estimates above.
United States; plumbers, pipefitters and steamfitters; 2025 employment shares. Selected industries do not sum to 100%.
| Measure / group | Figure | Period / original source |
|---|---|---|
| Plumbing, heating and AC contractors # | 65% | 2025 U.S. Bureau of Labor Statistics |
| Self-employed # | 8% | 2025 U.S. Bureau of Labor Statistics |
| Government (excluding education/hospitals) # | 3% | 2025 U.S. Bureau of Labor Statistics |
| Heavy and civil engineering construction # | 3% | 2025 U.S. Bureau of Labor Statistics |
| Manufacturing # | 3% | 2025 U.S. Bureau of Labor Statistics |
How large is the plumbing and HVAC contractor industry?
The 2023 Census benchmark counts 111,207 paid-employee establishments in plumbing, heating and air-conditioning contracting across the United States. A business with several locations can have several establishments.
Paid-employee establishments in plumbing, heating and air-conditioning contracting (2017 NAICS 238220); all legal forms; all employee roles; excludes nonemployers. This industry includes commercial work as well as residential service. Combined plumbing/HVAC industry; not plumbing-only.
| Measure / group | Figure | Period / original source |
|---|---|---|
| U.S. contractor establishments # | 111,207 establishments | 2023 U.S. Census Bureau (ZIP) |
| U.S. contractor industry employment # | 1,214,761 employees | 2023 U.S. Census Bureau (ZIP) |
| U.S. contractor industry annual payroll # | $89,519,407,000 | 2023 U.S. Census Bureau (ZIP) |
Plumbing/HVAC contractor establishments by state
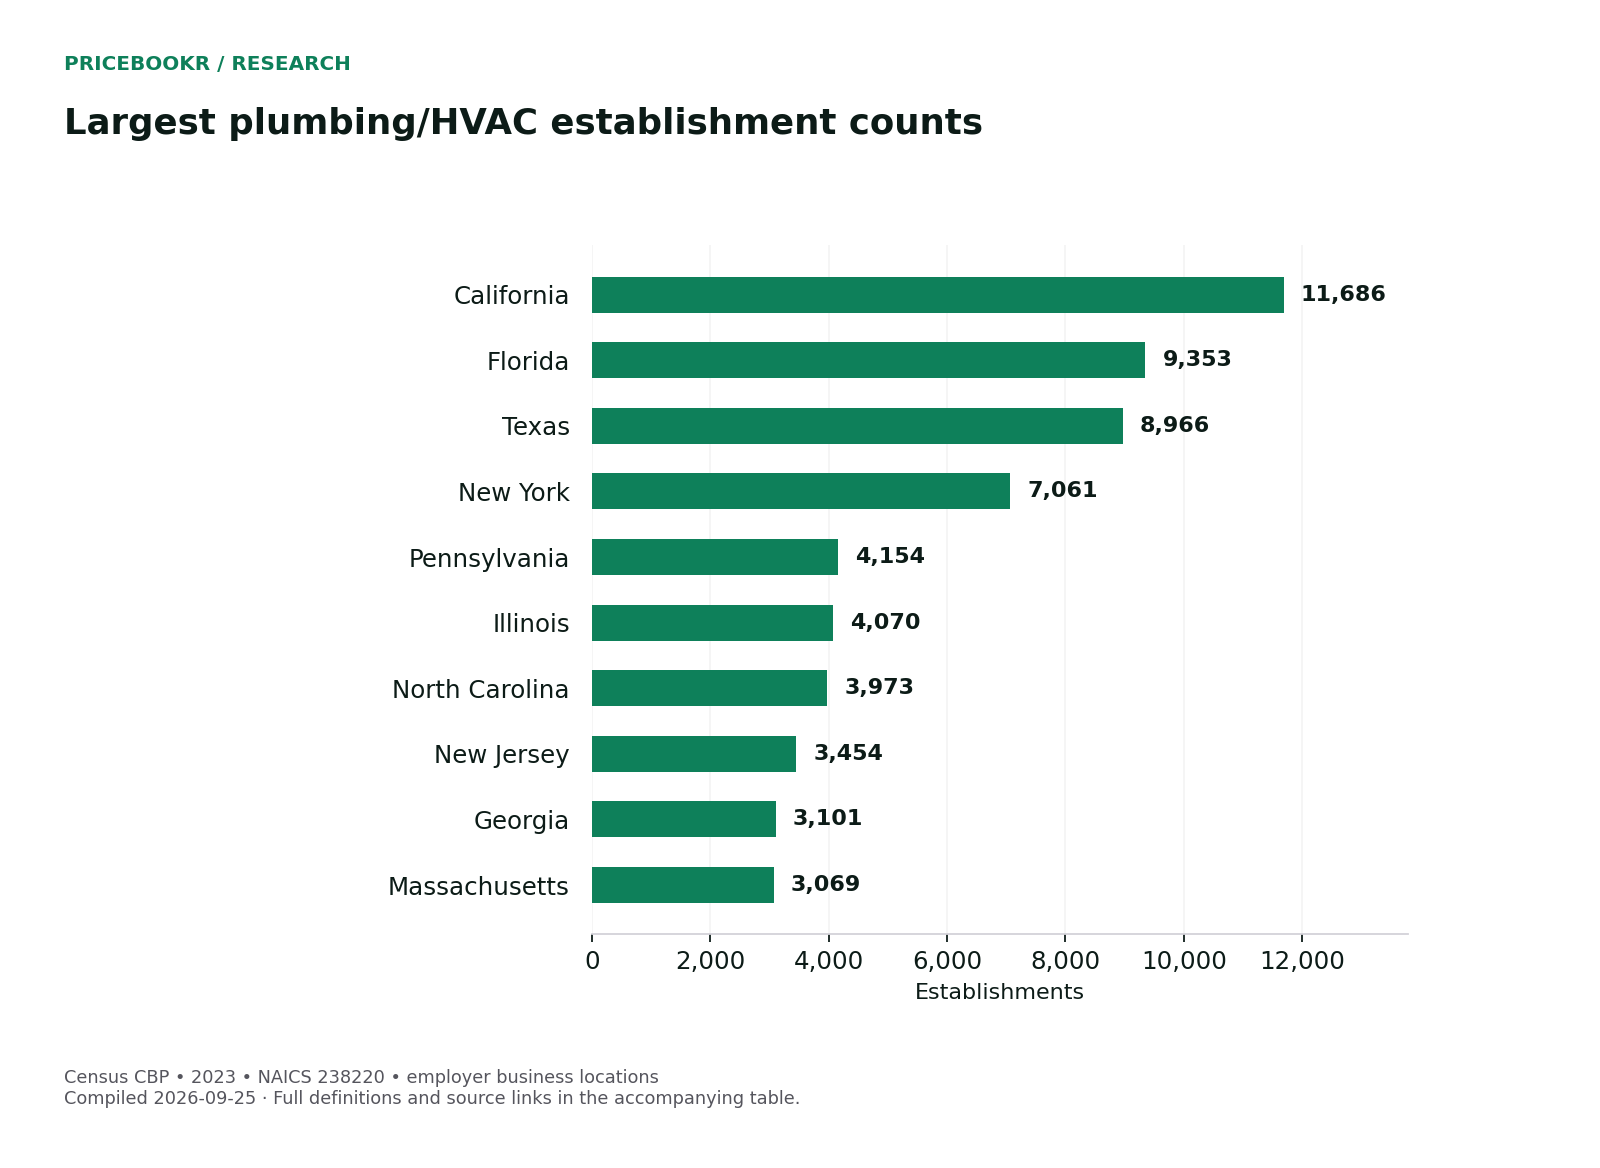
Compare the number of paid-employee business locations in each state and DC. Census combines plumbing, heating and air conditioning, so this table cannot isolate plumbing-only businesses.
Paid-employee establishments in plumbing, heating and air-conditioning contracting (2017 NAICS 238220); all legal forms; all employee roles; excludes nonemployers. Data year: 2023. Combined plumbing/HVAC industry; not plumbing-only.
| Measure / group | Figure | Period / original source |
|---|---|---|
| Alabama # | 1,647 establishments | 2023 U.S. Census Bureau (ZIP) |
| Alaska # | 264 establishments | 2023 U.S. Census Bureau (ZIP) |
| Arizona # | 2,567 establishments | 2023 U.S. Census Bureau (ZIP) |
| Arkansas # | 1,145 establishments | 2023 U.S. Census Bureau (ZIP) |
| California # | 11,686 establishments | 2023 U.S. Census Bureau (ZIP) |
| Colorado # | 2,620 establishments | 2023 U.S. Census Bureau (ZIP) |
| Connecticut # | 1,318 establishments | 2023 U.S. Census Bureau (ZIP) |
| Delaware # | 344 establishments | 2023 U.S. Census Bureau (ZIP) |
| District of Columbia # | 37 establishments | 2023 U.S. Census Bureau (ZIP) |
| Florida # | 9,353 establishments | 2023 U.S. Census Bureau (ZIP) |
| Georgia # | 3,101 establishments | 2023 U.S. Census Bureau (ZIP) |
| Hawaii # | 403 establishments | 2023 U.S. Census Bureau (ZIP) |
| Idaho # | 904 establishments | 2023 U.S. Census Bureau (ZIP) |
| Illinois # | 4,070 establishments | 2023 U.S. Census Bureau (ZIP) |
| Indiana # | 2,008 establishments | 2023 U.S. Census Bureau (ZIP) |
| Iowa # | 1,108 establishments | 2023 U.S. Census Bureau (ZIP) |
| Kansas # | 1,028 establishments | 2023 U.S. Census Bureau (ZIP) |
| Kentucky # | 1,379 establishments | 2023 U.S. Census Bureau (ZIP) |
| Louisiana # | 1,623 establishments | 2023 U.S. Census Bureau (ZIP) |
| Maine # | 781 establishments | 2023 U.S. Census Bureau (ZIP) |
| Maryland # | 1,986 establishments | 2023 U.S. Census Bureau (ZIP) |
| Massachusetts # | 3,069 establishments | 2023 U.S. Census Bureau (ZIP) |
| Michigan # | 2,661 establishments | 2023 U.S. Census Bureau (ZIP) |
| Minnesota # | 1,816 establishments | 2023 U.S. Census Bureau (ZIP) |
| Mississippi # | 709 establishments | 2023 U.S. Census Bureau (ZIP) |
| Missouri # | 1,915 establishments | 2023 U.S. Census Bureau (ZIP) |
| Montana # | 712 establishments | 2023 U.S. Census Bureau (ZIP) |
| Nebraska # | 837 establishments | 2023 U.S. Census Bureau (ZIP) |
| Nevada # | 909 establishments | 2023 U.S. Census Bureau (ZIP) |
| New Hampshire # | 776 establishments | 2023 U.S. Census Bureau (ZIP) |
| New Jersey # | 3,454 establishments | 2023 U.S. Census Bureau (ZIP) |
| New Mexico # | 691 establishments | 2023 U.S. Census Bureau (ZIP) |
| New York # | 7,061 establishments | 2023 U.S. Census Bureau (ZIP) |
| North Carolina # | 3,973 establishments | 2023 U.S. Census Bureau (ZIP) |
| North Dakota # | 336 establishments | 2023 U.S. Census Bureau (ZIP) |
| Ohio # | 2,970 establishments | 2023 U.S. Census Bureau (ZIP) |
| Oklahoma # | 1,592 establishments | 2023 U.S. Census Bureau (ZIP) |
| Oregon # | 1,337 establishments | 2023 U.S. Census Bureau (ZIP) |
| Pennsylvania # | 4,154 establishments | 2023 U.S. Census Bureau (ZIP) |
| Rhode Island # | 494 establishments | 2023 U.S. Census Bureau (ZIP) |
| South Carolina # | 1,685 establishments | 2023 U.S. Census Bureau (ZIP) |
| South Dakota # | 401 establishments | 2023 U.S. Census Bureau (ZIP) |
| Tennessee # | 1,899 establishments | 2023 U.S. Census Bureau (ZIP) |
| Texas # | 8,966 establishments | 2023 U.S. Census Bureau (ZIP) |
| Utah # | 1,443 establishments | 2023 U.S. Census Bureau (ZIP) |
| Vermont # | 303 establishments | 2023 U.S. Census Bureau (ZIP) |
| Virginia # | 2,765 establishments | 2023 U.S. Census Bureau (ZIP) |
| Washington # | 2,242 establishments | 2023 U.S. Census Bureau (ZIP) |
| West Virginia # | 406 establishments | 2023 U.S. Census Bureau (ZIP) |
| Wisconsin # | 1,944 establishments | 2023 U.S. Census Bureau (ZIP) |
| Wyoming # | 315 establishments | 2023 U.S. Census Bureau (ZIP) |
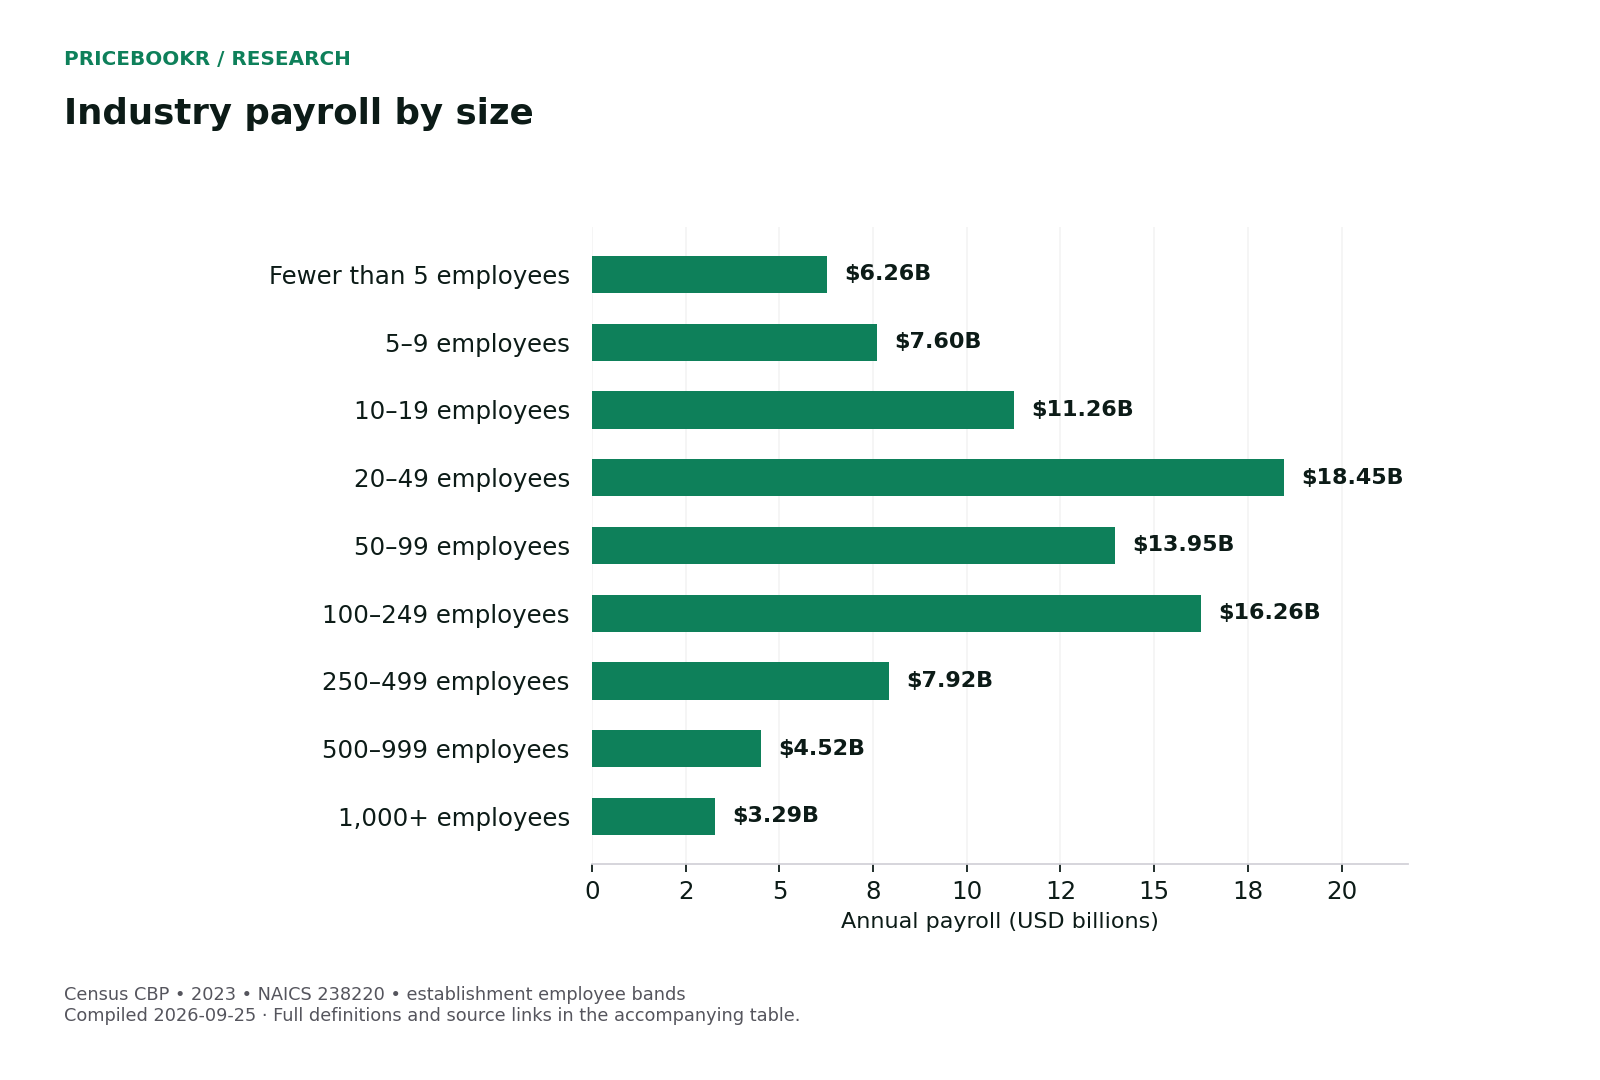
Contractor payroll by establishment size
Size classes refer to employment at each establishment. They do not describe the employee count of an entire multi-location company.
Paid-employee establishments in plumbing, heating and air-conditioning contracting (2017 NAICS 238220); all legal forms; all employee roles; excludes nonemployers. National totals; 2023. Combined plumbing/HVAC industry; not plumbing-only.
| Measure / group | Figure | Period / original source |
|---|---|---|
| Fewer than 5 employees # | $6,262,088,000 | 2023 U.S. Census Bureau (ZIP) |
| 5–9 employees # | $7,601,440,000 | 2023 U.S. Census Bureau (ZIP) |
| 10–19 employees # | $11,259,372,000 | 2023 U.S. Census Bureau (ZIP) |
| 20–49 employees # | $18,452,857,000 | 2023 U.S. Census Bureau (ZIP) |
| 50–99 employees # | $13,952,774,000 | 2023 U.S. Census Bureau (ZIP) |
| 100–249 employees # | $16,262,770,000 | 2023 U.S. Census Bureau (ZIP) |
| 250–499 employees # | $7,919,082,000 | 2023 U.S. Census Bureau (ZIP) |
| 500–999 employees # | $4,521,691,000 | 2023 U.S. Census Bureau (ZIP) |
| 1,000+ employees # | $3,287,333,000 | 2023 U.S. Census Bureau (ZIP) |
Plumbing price increases and home-service comparisons
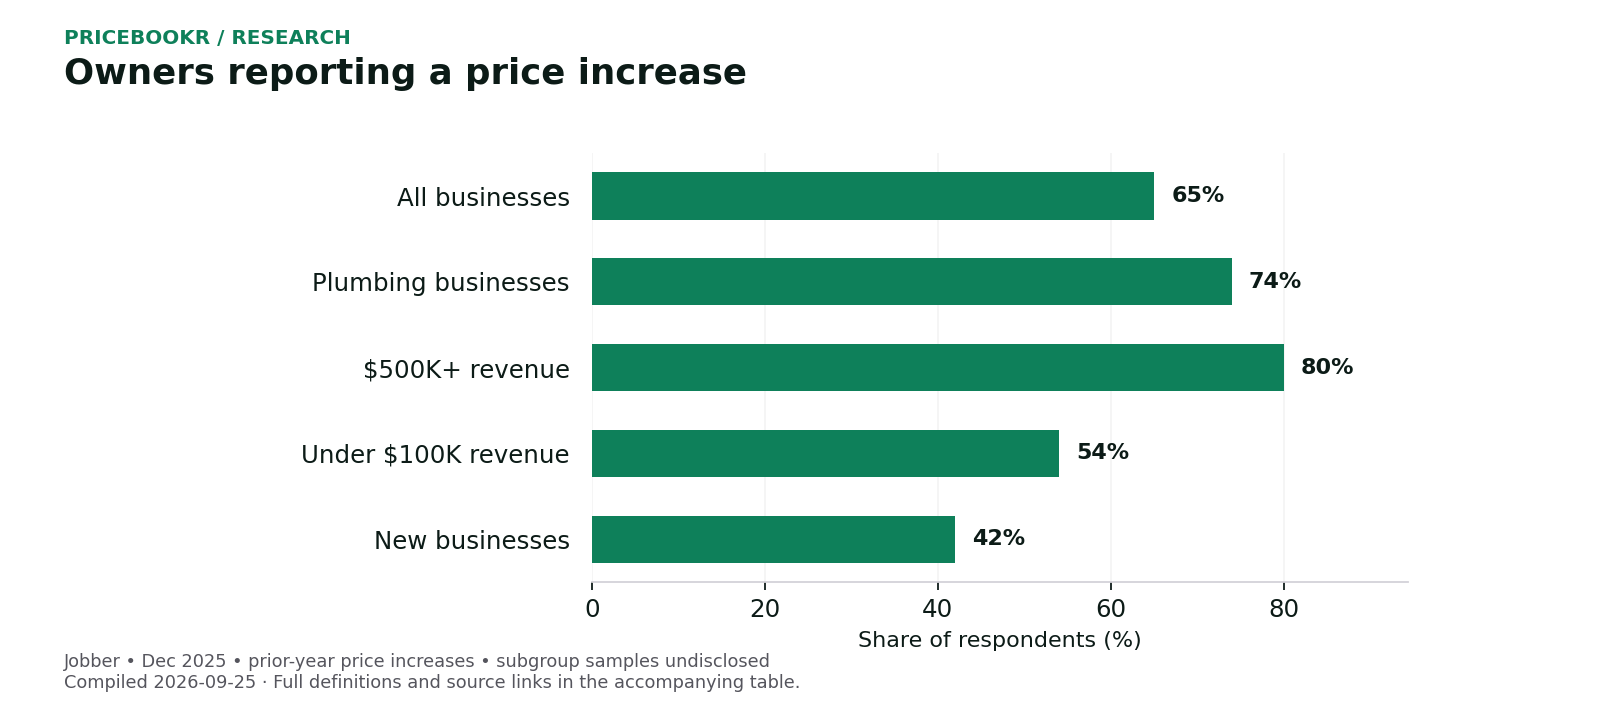
In Jobber’s December 2025 survey, 74% of plumbing business owners said they raised prices in the preceding year. The other rows compare broader home-service groups, not only this trade.
December 2025; U.S. owner survey; n=1,050 overall. Subgroup sizes unspecified. Price-change question refers to the preceding year.
| Measure / group | Figure | Period / original source |
|---|---|---|
| All businesses # | 65% | Dec 2025 survey Jobber |
| Plumbing businesses # | 74% | Dec 2025 survey Jobber |
| $500K+ revenue # | 80% | Dec 2025 survey Jobber |
| Under $100K revenue # | 54% | Dec 2025 survey Jobber |
| New businesses # | 42% | Dec 2025 survey Jobber |
How confident are owners in their pricing?
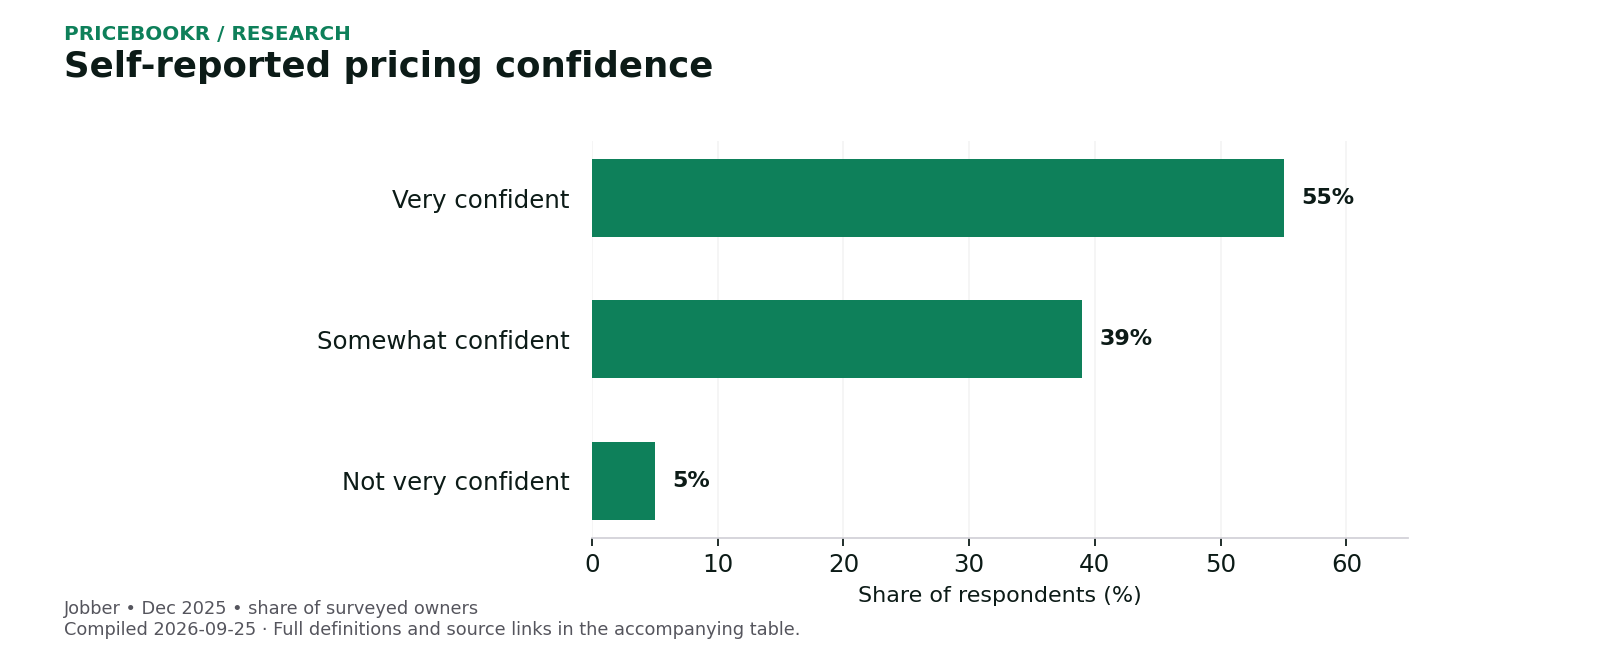
Confidence is a self-assessment. It does not show that a price covers labor burden, overhead, callbacks or profit.
Jobber owner survey; December 2025; n=1,050 overall. Displayed percentages total 99% because of rounding. Broad home-service/home-improvement sample; not plumbing-specific.
How many quotes do homeowners compare?
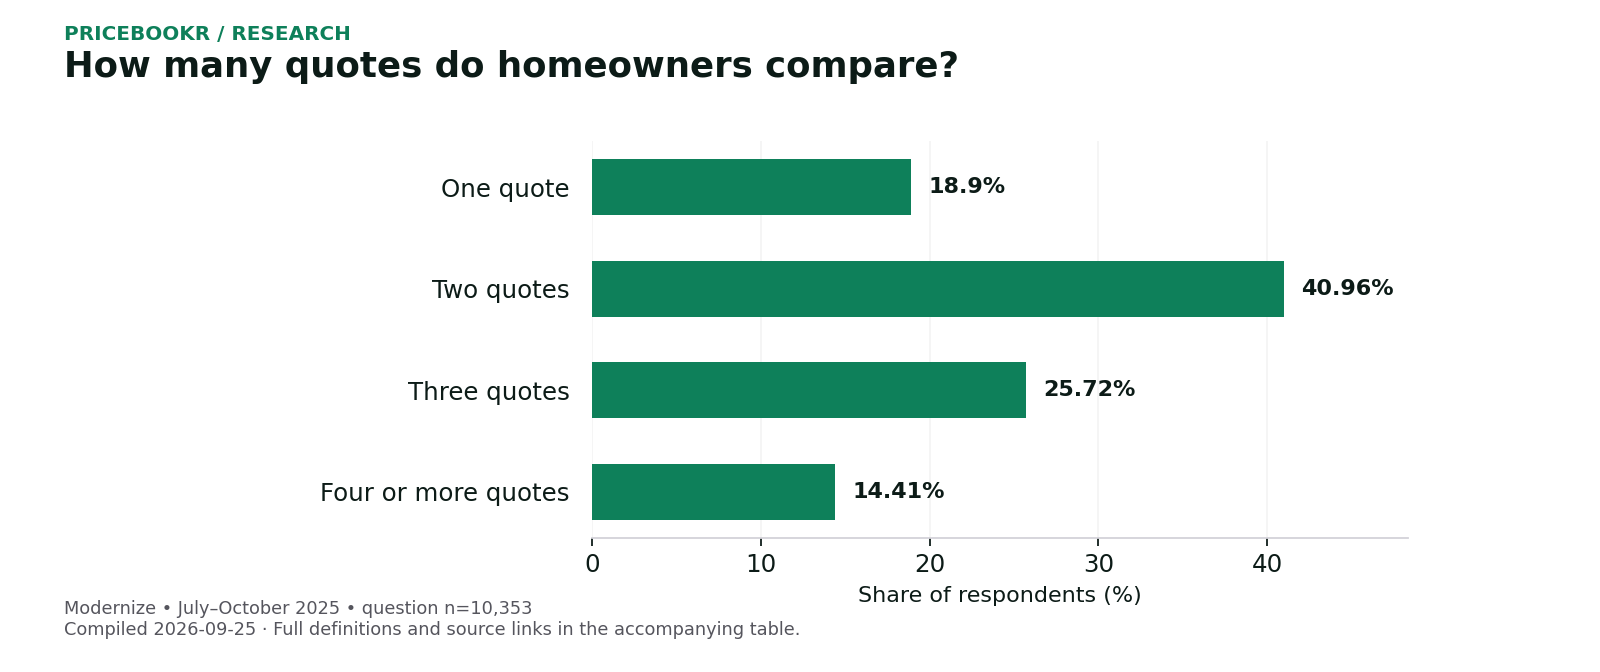
Two quotes was the most common answer in this Modernize question. These are intended comparisons for an upcoming project, not a measured close rate.
Homeowners answering how many contractors’ quotes they will compare. Modernize 2025 report; n=10,353 for this question. Fieldwork: July–October 2025. Broad home-service/home-improvement sample; not plumbing-specific.
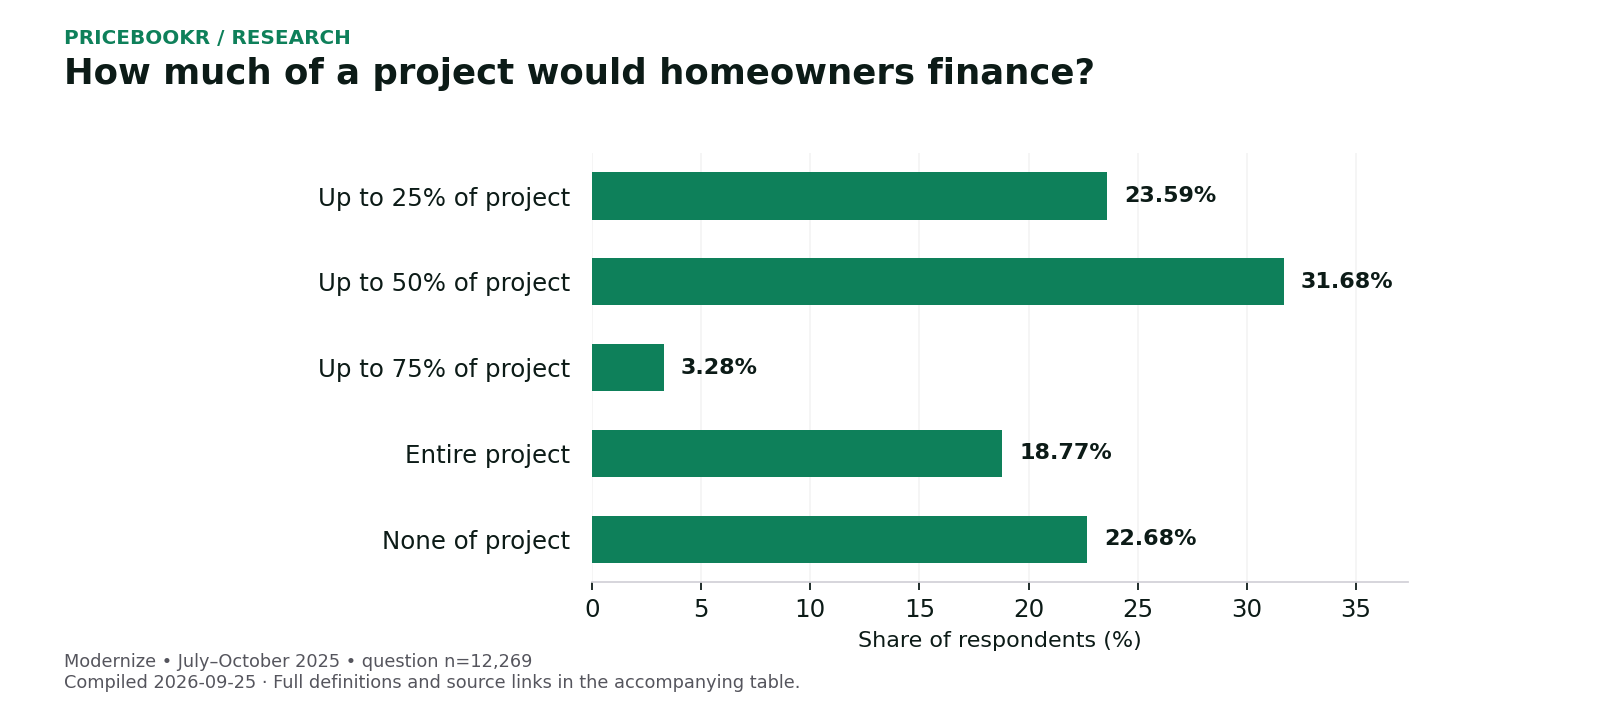
How much of a project would homeowners finance?
Respondents selected how much of an upcoming project they would want to finance if financing were available. These responses are preferences, not loan approvals or borrowing outcomes.
Homeowners answering a hypothetical project-financing question. Modernize 2025 report; n=12,269 for this question. Fieldwork: July–October 2025. Broad home-service/home-improvement sample; not plumbing-specific.
| Measure / group | Figure | Period / original source |
|---|---|---|
| Up to 25% of project # | 23.59% | Jul–Oct 2025 Modernize |
| Up to 50% of project # | 31.68% | Jul–Oct 2025 Modernize |
| Up to 75% of project # | 3.28% | Jul–Oct 2025 Modernize |
| Entire project # | 18.77% | Jul–Oct 2025 Modernize |
| None of project # | 22.68% | Jul–Oct 2025 Modernize |
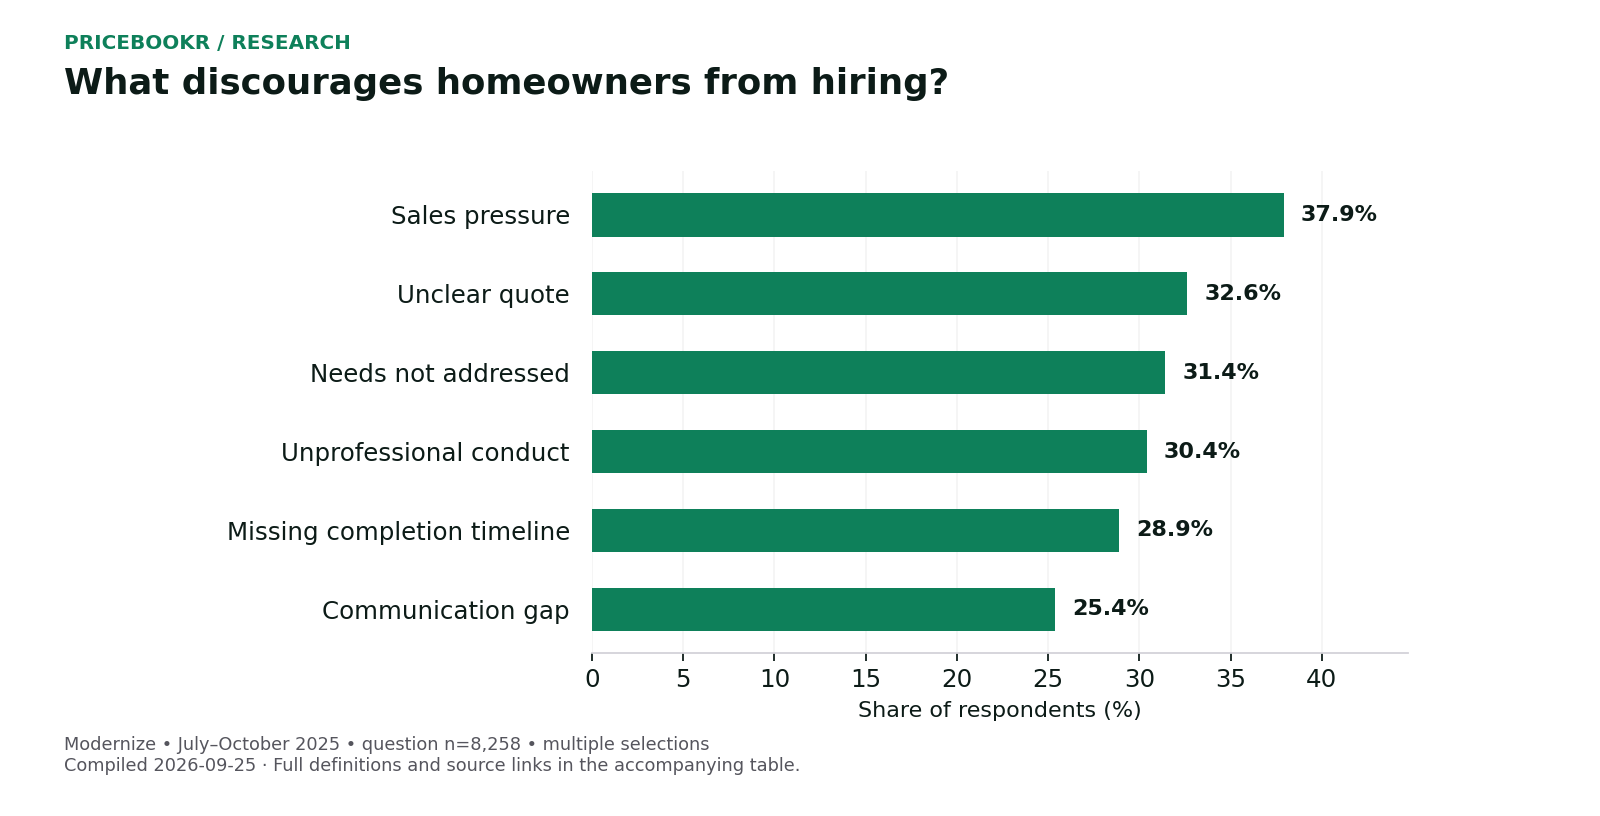
What discourages homeowners from hiring?
These selected responses identify friction in a contractor’s sales process. Respondents could choose multiple answers; the results cannot be added into a rejection rate.
Homeowners selecting sales attributes that make them least likely to hire. Modernize 2025 report; n=8,258 for this question. Fieldwork: July–October 2025. Broad home-service/home-improvement sample; not plumbing-specific.
| Measure / group | Figure | Period / original source |
|---|---|---|
| Sales pressure # | 37.9% | Jul–Oct 2025 Modernize |
| Unclear quote # | 32.6% | Jul–Oct 2025 Modernize |
| Needs not addressed # | 31.4% | Jul–Oct 2025 Modernize |
| Unprofessional conduct # | 30.4% | Jul–Oct 2025 Modernize |
| Missing completion timeline # | 28.9% | Jul–Oct 2025 Modernize |
| Communication gap # | 25.4% | Jul–Oct 2025 Modernize |
What do recent homebuyers want before hiring?
A written price can help a homeowner understand the proposed work. The finding below concerns expressed priorities in a survey, not the effect of any quoting software.
U.S. recent single-family homebuyers; Jobber-commissioned survey; May 2026; n=800, with equal generation groups. Broad home-service/home-improvement sample; not plumbing-specific.
Methodology and source notes
This is a curated reference compiled by Pricebookr. The organizations below collected or published the underlying data. Pricebookr has not conducted a new industry survey. Each distinct measure, population and period counts once; charts and headline cards repeat existing entries.
Industry boundaries matter. Census NAICS 238220 covers plumbing, heating and air-conditioning contracting, including commercial work and all employee roles. It combines plumbing with heating and air conditioning; these are not plumbing-only business totals. BLS occupation 47-2152 covers plumbers, pipefitters and steamfitters across industries. An establishment is a business location, not necessarily an independent company.
Payroll is not labor burden. Census payroll is converted from thousands of dollars to dollars by multiplying by 1,000. It is not revenue, an hourly service rate or a technician wage estimate. Payroll estimates have Census disclosure noise: G is less than 2%, H is 2% to less than 5%, and J is 5% or more. Row-specific flags are retained in the evidence ledger. No suppressed value is treated as zero. See the 2023 release and field definitions.
Survey limits. Owner and homeowner responses describe the stated samples. Subgroup results are not population forecasts. Multiple-choice percentages and rounded figures may not sum to 100. Modernize collected its 2025 responses during July–October; a country breakdown is not disclosed in the report. The Census tables are explicitly the 2023 vintage, not 2026 measurements.
- U.S. Bureau of Labor Statistics — Plumbers, pipefitters and steamfitters: Occupational Outlook Handbook
Published or updated: 2026-08-27. Checked: 2026-09-25.
OEWS wages (May 2025) and Employment Projections (2025–2035). Wage estimates exclude self-employed workers; projections include them. Openings include replacement needs.
- U.S. Census Bureau — 2023 County Business Patterns: United States
Published or updated: 2025-06-26. Checked: 2026-09-25.
Paid-employee establishments in plumbing, heating and air-conditioning contracting (2017 NAICS 238220); all legal forms; all employee roles; excludes nonemployers. Employment is mid-March. Payroll is annual, reported in thousands of dollars. Disclosure noise applies.
- U.S. Census Bureau — 2023 County Business Patterns: states and DC
Published or updated: 2025-06-26. Checked: 2026-09-25.
Paid-employee establishments in plumbing, heating and air-conditioning contracting (2017 NAICS 238220); all legal forms; all employee roles; excludes nonemployers. Employment is mid-March. Payroll is annual, reported in thousands of dollars. Disclosure noise applies.
- Jobber — 2026 Home Service Trends Report
Published or updated: 2026 report; day not stated. Checked: 2026-09-25.
Conjointly surveyed 1,050 U.S. home-service owners in December 2025. Self-reports; subgroup sample sizes unspecified.
- Jobber — Recent Homebuyer Reality Check
Published or updated: 2026 report; day not stated. Checked: 2026-09-25.
Coleman Parkes, May 2026: 800 U.S. single-family homebuyers from the preceding two years, equally split across four generations.
- Modernize — 2025 Homeowner Insights Report
Published or updated: 2025 report; day not stated. Checked: 2026-09-25.
Home-improvement audience surveyed July–October 2025 (PDF page 4). Each question has its own response count; probability sampling and country breakdown are not disclosed.
Original sources were inspected during compilation. Government ZIP files and the Modernize PDF were preserved for verification; automated access to some publisher URLs can be blocked. Retrieval notes in the evidence ledger distinguish successful downloads from later blocked rechecks. The evidence ledger includes table or page locations and retrieval notes. Next editorial review is targeted for December 15, 2026; the check date changes only after a fresh source review.
How to cite these statistics
Keep the data year, population and original publisher with the figure. Link to the original source for its finding and to the relevant section here for the compiled comparison.
Pricebookr. 107 Plumbing Statistics: Pay, Businesses & Pricing. September 25, 2026.
https://www.pricebookr.com/statistics/plumbing-contractor-statisticsUsing the numbers in a pricebook
Industry figures are context for a review. Build prices from your shop’s own costs, overhead and target margin. See markup schedules and the margin and markup calculator.
Keep pricing rules in one place
Pricebookr applies markup rules across your catalog and supports multiple pricebooks.
See Pricebookr for plumbing shops →